Introducing Gengo Girls

Introducing Genki Gengo Girls

Next Comic >>

Obviously you can’t learn an entire language just from reading a four panel comic strip, but “Gengo Girls” will do its best to cover the basics and provide a fun way for more advanced students to review what they already know.


Transcript

Blue: What did you think of yesterday’s Japanese assignment?

Yellow: I kind of… didn’t do it.

Blue: Oh my. Was it too hard?

Yellow: More like too boring! I just can’t get interested in reading our textbook.

Blue: But how are you going to learn Japanese if you don’t read the textbook?

Yellow: Easy! I’ll just find a web comic about two cute girls explaining Japanese to each other.

Yellow: Now strike a pose for the fourth wall!

Blue: We’ll do our best to help you learn Japanese, but you really should read a textbook too.

Let’s Program A Swarm Intelligence: Index And Code

Introduction


Welcome fellow AI enthusiasts. Have you ever heard the phrase “Swarm Intelligence” and wondered just exactly what that means? Then wonder no more because I have here for you a whole set of articles about how to use swarm intelligence techniques to build a flexible AI capable of optimizing a wide variety of mathematical problems and real world equations.


Basically it all boils down to something like this:

An animation of a swarm optimizing a sine wave based function

A really cool looking swarm intelligence


Index

Let’s Program A Swarm Intelligence 1: Introducing Particle Swarm Optimization

Let’s Program A Swarm Intelligence 2: Learning To Love Lisp

Let’s Program A Swarm Intelligence 3: All Your Max Are Min

Let’s Program A Swarm Intelligence 4: Specifying A Use Case

Let’s Program A Swarm Intelligence 5: Defining The Swarm

Let’s Program A Swarm Intelligence 6: Assembling The Swarm

Let’s Program A Swarm Intelligence 7: Satisfying My OCD

Let’s Program A Swarm Intelligence 8: It Lives!

Let’s Program A Swarm Intelligence 9: All Together Now

Let’s Program A Swarm Intelligence 10: Let Me See…

Let’s Program A Swarm Intelligence 11: Turning Your World Upside Down

Let’s Program A Swarm Intelligence 12: Is That A Trick Question?

Let’s Program A Swarm Intelligence 13: Welcome To The Nth Dimension

Let’s Program A Swarm Intelligence 14: Better Particles, Better Swarm

Let’s Program A Swarm Intelligence 15: The Return Of Maximize And Target

Let’s Program A Swarm Intelligence 16: The Swarm Ate My Homework


Complete Code

If you follow along with the posts you should be able to write your own swarm intelligence from scratch in whatever programming language you want. But if you don’t have the time for that or just want some reference code I have also provided my completed code: Lisp Swarm Intelligence

Let’s Program A Swarm Intelligence 16: The Swarm Ate My Homework

The Freshman Math Challenge


After roaming around on the Internet for a while I found a website offering open source college material including a rather decent worksheet on multi-variable optimization, which you can find here http://ocw.capilanou.ca/mathematics-statistics/math-109-calculus-ii/optimization-problems.pdf/view?searchterm=optimization.


I’ll be using problems from this worksheet to test out the swarm. Let’s see if we’ve built a machine smart enough to pass an entry level calculus class.


Profit Optimization


First problem from the worksheet is pretty straightforward. There is a random desk company that sells both finished and unfinished desks, although I’m not actually sure what they mean by this. Are they talking about whether or not the wood on the desk is properly stained, or by unfinished do they mean that they literally sell desks that are still missing pieces? Is there a big market for three legged desks?


Anyways, whatever an “unfinished” desk is the company’s revenue looks like this:


revenue = 200*finished + 160*unfinished – 0.2*finished*unfinished – 0.2*finished^2 – 0.25*unfinished^2.


The company’s expenses look like this


expense = 100*finished + 70*unfinished + 4000


The company’s profit is equal to its revenue minus its expenses, which we can represent as this Lisp function:


;Revenue for a company which sells both finished and unfinished furniture
(defun company-profit (fin unfin)
   (let ((revenue (+ (* 200 fin) 
                     (* 160 unfin) 
                     (* -0.2 fin unfin) 
                     (* -0.2 fin fin) 
                     (* -0.25 unfin unfin)))
         (expense (+ (* 100 fin) (* 70 unfin) 4000)))
      (- revenue expense)))


Now we just have to decide on some boundaries for our swarm guesses. Since you can’t produce less than 0 units of furniture our minimum bound for both types of desks will be 0. When it comes to the upper bounds we’ll have to take a bit of a guess. The bigger the boundary the larger our swarm will need to be to explore it and the longer the search will take, so we want to aim for an upper boundary that is small enough to be efficient while still being large enough to capture the maximum number of desks a company can reasonably build in one week.


Let’s start out with an upper bound of 10,000. That’s a pretty large number of desks for a small company to produce in a single week, so we should be safe. On the other hand, if that number is too small we’ll probably get an optimal solution right on the edge of our boundaries. If that happens we’ll just increase the boundaries and try again.


Now it’s time to put that all into action:


[5]> (defparameter *swarm-iterations* 200)

*SWARM-ITERATIONS*

[6]> (defparameter *swarm-size* 1000)

*SWARM-SIZE*

[7]> (defparameter *swarm-output* (swarm-maximize #’company-profit ‘((0 10000) (0 10000))))

*SWARM-OUTPUT*

[8]> (first *swarm-output*)

(200.04425 100.01073)


So it looks like the swarm thinks we should build 200 finished desks and 100 unfinished desks. And if we scroll down to the answer key portion of the worksheet that turns out to the right answer. Good job swarm!


Minimize Distances


Now let’s jump down to problem 3. A power station is being planned and they want to figure out the best place to put it so it can efficiently serve three different communities. Apparently this means they want to minimize the sum of the squares of the distances to each of the three communities which are positioned at (-4, 4) (5, 2) and (-1, -3).


Writing a function to calculate the sum of squares isn’t too hard, especially if we use the expt function to square things and the sqrt function to take square roots. Just remember that distance can be calculated by taking the square root of the square of the X and Y distances between two points and the following function should make perfect sense.


;Calculate the sum of squares of distances between a given point and the three points (-4, 4) (5, 2) and (-1, -3)
(defun sum-of-squared-distances (x y)
   (let ( (distance1 (sqrt (+ (expt (- x -4) 2) (expt (- y 4) 2))))
          (distance2 (sqrt (+ (expt (- x 5) 2) (expt (- y 2) 2))))
          (distance3 (sqrt (+ (expt (- x -1) 2) (expt (- y -3) 2)))))
      (+ (expt distance1 2) (expt distance2 2) (expt distance3 2))))


Time to choose our boundaries. Since we want to minimize the distance between the plant and the communities the power plant should logically be somewhere in the middle of the three points. So by looking at our points this means our x boundary needs to be between -4 and 5 and our y boundary needs to be between -3 and 4.


Time to let the swarm loose.


[29]> (defparameter *swarm-size* 25)

*SWARM-SIZE*

[30]> (defparameter *swarm-iterations* 100)

*SWARM-ITERATIONS*

[31]> (defparameter *swarm-output* (swarm-minimize #’sum-of-squared-distances ‘((-4 5) (-3 4))))

*SWARM-OUTPUT*

[32]> (first *swarm-output*)

(-7.074524E-4 1.0000945)


According to the swarm the best place for the power plant is around (0, 1), which matches up with the answer key. Another victory for the swarm!


A Problem With Extra Requirements


Now let’s go back to problem 2. This one turned out to be rather tricky.


At first it looks like a pretty simple. We have a package with length, width and depth (like all 3D objects). We want to maximize the volume. Just a simple 3 variable maximization, right?


Except that postal regulations require that the length and girth of the box have to add up to less than 108 inches. Or as the worksheet is happy to summarize: 2x + 2y + z <= 108.


This is a problem because our swarm is designed to make completely random guesses for x, y and z. We can give it some general guidelines like “x has to be between 0 and 10” but we can’t give it a complex constraint like “x plus y plus z needs to be less than 100”.


So at first it seems like our swarm just isn’t smart enough for this problem. But maybe there is a clever way around this issue. Take a look a this function:


;Calculates the volume of a package that has to have a combined length and girth of less than 108
(defun postal-package-volume (x y z)
   (if (> (+ (* 2 x) (* 2 y) z) 108)
       -1
       (* x y z)))


If the user tries to calculate the volume of a package that’s too big to mail we return -1 instead of the volume. Not only is this a good way to let a human know that there is a problem with their input, it also works great with our swarm. Since we want to maximize volume an “error” value of -1 will always be considered less optimal than even the worst of “acceptable” answers, all of which are positive.


In other words, instead of trying to prevent the swarm from making unacceptable guesses we just make sure that unacceptable guesses are always less optimal than acceptable guesses.


Time to see if it works. Our boundaries are based off the fact that a box can’t have negative length and that the definition of girth means that 54 is the biggest x and y values possible and that 108 is the biggest possible z.


[44]> (defparameter *swarm-size* 25)

*SWARM-SIZE*

[45]> (defparameter *swarm-iterations* 100)

*SWARM-ITERATIONS*

[46]> (defparameter *swarm-output* (swarm-maximize #’postal-package-volume ‘((0 54) (0 54) (0 108))))

*SWARM-OUTPUT*

[47]> (first *swarm-output*)

(17.743437 18.024296 36.464497)


If we look at the answer key the true maximum is (18, 18, 36), which is pretty close to the swarm’s guess. Looks like our workaround for the input constraints worked!


Conclusion And Extra Challenges


That’s it. We wrote a general swarm optimizer smart enough to ace a freshman calculus assignment. So while our swarm isn’t anywhere near being a professional quality artificial intelligence I think it’s more than good enough to be considered a successful “Let’s Program”.


Of course, I’m sure there are plenty of you out in the audience who don’t want to stop here. If you want to forge on ahead on your own here are a few sample projects you might want to consider tackling next:


  • Find more complicated optimization problems that require more than 3 variables. Does the swarm find the right answer? If not, fix it until it does.
  • Improve particle behavior by giving them memory of their personal best answer and having them adjust their velocity based on a combination of current velocity, swarm best and personal best.
  • Create multiple types of particles, such as scout particles that don’t care so much about the swarm best and random particles that bounce around problem space even when the rest of the swarm has settled on a possible best answer. This would be a great place to practice object oriented programming.


And with these final suggestions I bid you adieu. All that’s left is the index page. Thanks for following along!

Let’s Program A Swarm Intelligence 15: The Return of Maximize and Target

Solving A Problem We Already Solved


Last post we upgraded our swarm so that it could successfully minimize problems with any number of variables. All that’s left now is to teach it how to maximize and how to aim for specific results.


By now you should understand that maximization is just minimization turned upside down and hitting a target is the same as minimizing the difference between the results you are getting and the results you want.


Thanks to this insight we were able to easily write a 2D maximizer and target seeker by just using our already written minimizer. Now it’s time to do the same thing for the general swarm.


The tricky part here has to do with arguments.


In the 2D swarm we knew that everything would have two variables, so we were able to use lambda to build new two variable functions on demand. Then we passed that new two variable function to swarm-minimize-2d, which gave it the two arguments it expected.


But this time things are different. The general swarm-minimize uses apply to pass an unpredictable number of variables to our function. Which means that the new lambda function we build has to be able to accept a flexible number of variables and then pass them all on the the original function.


Fortunately for us Lisp is all ready to handle this problem thanks to the keyword &rest. Put inside of a function declaration this basically means “A list of every extra variable in the function call”.


A quick demo:


(defun rest-test (first second &rest extra)
   (format t “This is the first argument: ~a~%” first)
   (format t “This is the second argument: ~a~%” second)
   (format t “There were ~a extra arguments:~%” (length extra))
   (loop for argument in extra do (format t “~a~%” argument)))


[9]> (rest-test “one” “two” “three”)

This is the first argument: one

This is the second argument: two

There were 1 extra arguments:

three

NIL

[10]> (rest-test “one” “two” “three” “four” “five”)

This is the first argument: one

This is the second argument: two

There were 3 extra arguments:

three

four

five

NIL


This is exactly what we need in order to create a lambda function that can take a flexible number of variables and pass them all along to an inner function. Upgrading the 2D maximize and target functions is now simple:


(defun swarm-maximize (fn boundaries)
   (swarm-minimize (lambda (&rest arguments) (* -1 (apply fn arguments) boundaries))))

(defun swarm-target (fn target boundaries)
   (swarm-minimize-2d (lambda (&rest arguments) (abs (- target (apply fn arguments)))) boundaries))


Let’s take these new functions for a spin:


[16]> (defparameter *swarm-iterations* 100)

*SWARM-ITERATIONS*

[17]> (defparameter *swarm-output* (swarm-maximize #’inverse-double-parabola ‘((-10 10)(-10 10))))

*SWARM-OUTPUT*

[18]> (first *swarm-output*)

(5.114901E-5 4.665053E-7)

[19]> (defparameter *swarm-output* (swarm-target #’triple-parabola 7 ‘((-10 10)(-10 10)(-10 10))))

*SWARM-OUTPUT*

[20]> (first *swarm-output*)

(-1.5512012 0.78995675 -1.9924128)

[21]> (triple-parabola -1.5512012 0.78995675 -1.9924128)

6.9999657


Success on both counts!


Coincidentally, this also shows off that our general swarm optimizer can handle 2D problems just as well as the specific 2D swarm optimizer. This is nice because it let me test maximization on a function we already had and saved me the trouble of writing an inverse triple parabola.


Time To Give The Swarm A Real Run For It’s Money


Ok, so we were able to maximize and target a couple of parabolas using the general swarm. But that’s not really very impressive. Parabolas are easy to solve and these weren’t even high dimensional problems.


So for my next and final “Let’s Program A Swarm Intelligence” I’m going to pull out all the stops and try to find some real world multi-variable problems to test this thing on. I’m sure I have a few engineering and calculus textbooks laying around with interesting problems just waiting to be solved.


Let’s Program A Swarm Intelligence 14: Better Particles, Better Swarm

The End Is Near


Last time we successfully upgraded our particle objects to be flexible enough to work in any number of dimensions so they can help us optimize problems with any number of variables. Now all we need to do is upgrade our old 2D swarm algorithms to use these new super-particles and we’ll have a complete, generalized particle swarm optimizer.


Fair warning: A lot of the code in this post looks really complicated. And I guess it kind of is. But remember that everything we are doing in this post is something we’ve already done successfully in two dimensions and that the basic logic is the same. Just remember the basics of swarm logic (make a lot of guesses, update your guesses, repeat) and you should be fine.


Also, we can’t really develop a general swarm optimizer without a few multi-variable problems to test it on. So behold, Multi-dimensional parabolas!


(defun triple-parabola (x y z)
   (+ (* x x) (* y y) (* z z)))

(defun quadruple-parabola (x y z w)
   (+ (* x x) (* y y) (* z z) (* w w))


Once again the obvious minimum for both these problems is when all the inputs are set to 0. That’s (0, 0, 0) for the triple parabola and (0, 0, 0, 0) for the quadruple parabola. Hopefully the swarm will be able to figure that out too.


A More General Swarm Definition


The first step in upgrading our particles was to remove specific references to 2D ideas like X and Y and then replace them with flexible lists that can grow to whatever size the problem demands. Similarly the first step in upgrading the swarm itself is to remove specific 2D references and replace them with more flexible structures.


The big change here is that our 2D swarm used to keep track of the best X and Y coordinates any particle had found so far. We will now replace those with one “best-coordinates” variable that we will use to store a copy of the entire coordinates list of any particle that manages to find a good possible answer. This way we can have one variable that works no matter how long the coordinate list gets.


(defclass swarm ()
   ((best-coordinates
       :accessor best-coordinates
       :initform nil)
    (best-answer
       :initarg :best-answer
       :accessor best-answer
       :initform most-positive-long-float)
    (particle-list
       :accessor particle-list)))


Next up is creating a handy swarm generating function. Just like with the particle generator function the main focus of this upgrade will be to remove specific references to X and Y limits and replace them with a flexible “boundaries” list that will include a min and max pair for every variable in the problem we are minimizing.


(defun generate-swarm (particle-count boundaries)
   (let ((new-swarm (make-instance 'swarm)))
      (setf (particle-list new-swarm)
            (loop for i from 1 to particle-count
             collect (generate-particle boundaries)))
      new-swarm))


Most of the hard “boundaries” work was already done inside of generate-particle so this upgrade was as easy as swapping out a few old variables for a new one and making sure that “new-swarm” is created as a swarm object instead of a swarm-2d object.


Same Logic, More Numbers


Upgrading the swam logic is pretty easy. We just replace the idea of x-limit and y-limits with a single boundary variable and then switch to the non-2D version of every function call.


(defun swarm-minimize (fn boundaries)
   "A general particle swarm optimizer"
   (let ((swarm (generate-swarm *swarm-size* boundaries)))
      (loop for i from 1 to *swarm-iterations* do
         (loop for particle in (particle-list swarm)
           do (update-swarm-particle particle swarm fn boundaries)))
      (list (best-coordinates swarm) (get-swarm-history swarm))))


Only problem is… not all of these functions exist yet. So before swarm-minimize can actually be used for anything we’re going to have to write our new generic update-swarm-particle. Watch out because this one is a doozy!


(defun update-swarm-particle (particle swarm fn boundaries)
   (update-particle-history particle)
   (let ((particle-answer (apply fn (coordinates particle))))
      (when (< particle-answer (best-answer swarm))
         (setf (best-answer swarm) particle-answer)
         (setf (best-coordinates swarm) (coordinates particle))))
   (update-particle-velocity particle (best-coordinates swarm))
   (setf
      (coordinates particle)
      (loop
         for position in (coordinates particle)
         for velocity in (velocity particle)
         for bounds in boundaries
         collect (max (first bounds) (min (second bounds) (+ position velocity))))))


Let’s start with the easy changes. We switch from update-particle-history-2d and update-particle-velocity-2d to the more general versions that we’re about to write. We also switch from funcall to apply for generating the answer associated with a particular particle position. apply is basically a funcall that expects it’s input in a list instead of typed out as individually which works really great now that our input is all in a list.


Then comes the hard part: updating particle positions. We used to just manually update X and Y position based of of X and Y velocity and X and Y limits, but we need more flexibility than that now that our coordinates, velocity and limits are all stored in lists instead of predictable variables.


Once again we’re going to turn to the mighty loop macro to solve this list based problem. Our goal is to process an entire list of coordinates using an entire list of velocities and in order to do that we’re going to take advantage of a handy loop trick that lets us iterate over multiple collections at the same time. You just include more than one “for variable in collection” inside the start of your loop and then every time you go through the loop you get one item from every collection. The first time through the loop you get the first item from every collection, the second time you get the second item from every collection and so on.


This is great because in order to update a particle we need to be able to update the first coordinate by using the first part of velocity and then making sure the result is inside of the first boundaries. Then we need to update the second coordinate with the second part of velocity and the second set of boundaries. So on with the third and fourth and however many dimensions we have. It’s the perfect place for the multiple-collection-loop trick.


Anyways, the end result of all our looping is to calculate a set of new coordinates, collect them into a big list and then replace the old particle coordinate list with the updated one.


Of course, the above function won’t work without an update update-particle-velocity, so let’s tackle that next. Its upgrade requires the same sort of loop tricks so if you understood the last function this one will be even easier. If you didn’t understand the last function, carefully read through it again.


(defparameter *original-velocity-weight* 0.8)
(defparameter *target-velocity-weight* 0.3)

(defun update-particle-velocity (particle target-coordinates)
   (setf
      (velocity particle)
      (loop
         for original-velocity in (velocity particle)
         for position in (coordinates particle)
         for target in target-coordinates
         collect (let ((target-velocity (- target position)))
                    (+ (* *target-velocity-weight* target-velocity)
                       (* *original-velocity-weight* original-velocity))))))


Let’s remember back to how the 2D version of this function worked. For both X and Y we compared where the particle currently was to where the swarm’s best answer so far was and used this to calculate a target-velocity that would lead the particle to the best answer. We then took some fraction of this target seeking velocity and added it to some fraction of the particle’s original velocity. This meant that over time particles would eventually gravitate towards the swarm best.


The generic version uses a loop to do the same thing. It grabs one component of its current velocity, one component of its current position and one component of the target swarm-best coordinate. It then calculates a target-velocity for just that one portion of the velocity, mixes it in with the current velocity and collects the whole thing into the new velocity list that we eventually set as the particles new velocity. In other words, if we were solving a 3D three variable problem the first trip through the loop would use X position, X velocity and X best-coordinates to calculate a new X velocity. Then the second loop would update the Y velocity and the third loop would update the Z velocity.


With that tricky function out of the way all that’s left are a couple useful history related helper functions:


(defun update-particle-history (particle)
   (setf
      (history particle)
      (append
         (history particle)
         (list (coordinates particle)))))


(defun get-swarm-history (swarm)
   (loop for particle in (particle-list swarm)
    collect (history particle)))


The first is basically identical to the 2D versions. The second one IS identicle to the 2D version, but I’m defining it anyways because every other function has a 2D vs generic version and I’d hate for it to feel left out.


Testing The Swarm


That was a lot of fairly complicated code. Now it’s time to see if all our hard work paid off and the new code works just as well as the old.


[94]> (defparameter *swarm-iterations* 75)

*SWARM-ITERATIONS*

[95]> (defparameter *swarm-output* (swarm-minimize #’triple-parabola ‘((-10 10) (-10 10) (-10 10))))

*SWARM-OUTPUT*

[96]> (first *swarm-output*)

(-0.0012116772 -0.009321406 -0.013946425)

[97]> (defparameter *swarm-output* (swarm-minimize #’quadruple-parabola ‘((-10 10) (-10 10) (-10 10)(-10 10))) )

*SWARM-OUTPUT*

[98]> (first *swarm-output*)

(-0.067994416 -0.08707443 -0.026546227 0.037088722)


Success! Our swarm is within a rounding error of the true minimum on both the triple and quadruple parabola.


Didn’t You Forget Something?


Exceptionally observant readers might have noticed that there are two 2D functions that don’t have a general version yet: swarm-maximize and swarm-target. But this post is already getting pretty long so I’ll tackle that problem next time. See you then!

Let’s Program A Swarm Intelligence 13: Welcome To The Nth Dimension

We Can Rebuild It, Better Than Before


If you remember, way back in the planning stages we split our program into a two-stage process:


  1. Design a 2D swarm intelligence that can optimize functions with two inputs
  2. Upgrade the 2D swarm to handle functions with any number of inputs, not just 2


We have already finished goal number 1 and solved most of the logic and math problems involved in running a swarm intelligence. Now all we need to do is modify our existing solutions so that their logic can handle more than two numbers at once.


Obviously this is going to require several changes, some big and some small. For instance, since we are no longer guaranteed to always be working with 2D swarms we are going to need to create a way to tell the swam how many dimensions to work with. We are also going to need to make our data structures more flexible. Just storing X and Y data won’t be enough if we’re trying to optimize a 5 dimensional equation.


So let’s start solving these problems!


Which Dimension Are We In?


It makes sense that one of the first steps in optimizing a problem is to identify how many variables you’re working with. The swarm needs to know how many dimensions to search, what kind of particles to build (2D? 3D? 11D?) and how many boundaries to expect. The whole program will crash if you try to feed a five variable equation into a swarm that is only generating four variable solutions.


The easiest way to let the swarm know how many variables it needs is to just tell it by passing some sort of dimension variable. Something like this:


(defun swarm-minimize (fn dimension boundaries)
   ; swarm code will go here)


Which we could then call like this:


; Minimizing a 3 variable equation

(swarm-minimize #’some-function 3 ‘((-5 5) (-10 3) (0 6)))

;Minimizing a 5 variable equation

(swarm-minimize #’another-function 5 ‘((-2 0) (3 6) (-3 3) (-5 -4) (0 100)))


Now if you look at those function calls you might have noticed that the dimension number always matches up to the number of pairs in the boundaries list. If you have three variables then you need to know what the min and max possible values for all three variables is. If you have five variables then you need five boundaries. And so on.


But if the dimension of the problem is always equal to the length of the boundary list… do we really need to keep track of dimension separately? Probably not. In fact, as I was working on this problem I found that I almost never needed the dimension of the problem as a number. It was much easier and faster to just loop over the boundary list, run some code for every pair in the list and then finish up when I had used them all once.


So the best way to keep track of the dimension of the problem is by making sure the boundary list is accurate. After that everything else falls into place. If we ever find out we really do need dimension as a number we can just retrieve the length of the boundary list. So our actual function definition will look something like this:


(defun swarm-minimize (fn boundaries)
   ; swarm code will go here)


; Minimizing a 3 variable equation

(swarm-minimize #’some-function ‘((-5 5) (-10 3) (0 6)))

;Minimizing a 5 variable equation

(swarm-minimize #’another-function ‘((-2 0) (3 6) (-3 3) (-5 -4) (0 100)))


More Than One Way To Skin An N-Dimensional Cat*


We just solved the issue of how to keep track of how many dimensions the swarm is working in. Next up is figuring out how to help the particles keep track of their locations/guesses in dimensions other than two. After all, if we are trying to optimize a function that requires five inputs then every guess is going to be made up of five numbers, represented as a single five dimensional particle.


In our two-dimensional swarm every particle object had specific data slots for its x position, y position, x velocity and y velocity. This worked really well because we knew we would always have exactly that much data. But now that we are trying to build a general swarm we’re going to need a much more flexible data structure, something that can hold a list with as many or as few coordinates as we need.


When I hear “list of coordinates” two data structures come to mind. The first one is, obviously, the list. The second one is the array. Both can be made whatever size we want and are perfect for holding the random numbers that make up a particle coordinate.


If we are working with a five dimensional swarm we need either a five item list or a five slot array. If we are working with a ten dimensional swarm we would need either a ten item list or a ten slot array. Here’s an example:


; The five dimensional point < 1, 2, -5, 2, 4 > as both a list and an array

(list 1 2 -5 2 4)

(make-array 5 :initial-contents ‘(1 2 -5 2 4))


So which one should we use? To be honest, I struggled with this decision. Both arrays and lists have strengths and weaknesses. Lists are very flexible and allow for interesting nested data structures, but arrays are much more efficient when it comes to reading random data out of the middle of a collection.


Of course, for something as simple as a coordinate or velocity we don’t really need fancy nested data structures, so clearly we don’t need lists and should go with the array so we can get the benefit of efficient random reads.


But wait! Do we actually need to random access to our data? Are there going to be any situations where we have a 100 dimensional particle and want to grab just the 63rd portion of its coordinate? It turns out the answer is no. In our swarm intelligence we always want to work with entire lists. For instance, when we update the position of a particle we update the entire coordinate list by referencing the entire velocity list.


So we will never say “Give me just the 32nd coordinate of this particle”. We will always say, in order, “Give me the first coordinate and first velocity of this particle. Now give me the second coordinate and second velocity. Now give me the third coordinate and third velocity…”


So which data structure is more efficient for reading an entire set of numbers all in a row: Lists of arrays? Honestly, there isn’t much difference. Just choose whatever is most convenient for you.


I’m going with lists.


Upgrading Particles – No Vespene Gas Required!


With those two major design decisions nailed down we have everything we need in order to build a generic handles-as-many-variables-as-you-need swarm particle. I wrote all of the following code by starting with a copy of our 2D swarm functions, removing the 2D from the name and then changing the code as needed.


First up is our new super-powered generic swarm particle, able to leap large dimensions in a single bound!


(defclass particle ()
   ((coordinates
      :initarg :coordinates
      :accessor coordinates)
    (velocity
      :initarg :velocity
      :accessor velocity)
    (history
      :accessor history
      :initform () )))


The jump to N-Dimensions has actually made the particle class simpler. Instead of having seperate data slots for x position, y position, x velocity and y velocity we just have two data slots, coordinates and velocity. These slots will eventually hold lists of data. For example, in a particle trying to solve a 4D equation coordinates might equal (1 2 2 5) and velocity might equal (-2 4 7 3).


Moving on, now that we have a new particle class we need a new function to help build particles. This is probably the most complicated code we’re writing today so put on your thinking cap and take a good look at it. If it just doesn’t click you might want to scroll down to the next section and see the example of how this function gets called.


(defun generate-particle (boundaries)
   (let ((coordinates (list))
         (velocity (list)))
      (loop for boundary in boundaries
         do (let* ((lower-bound (first boundary))
                   (upper-bound (second boundary))
                   (range (- upper-bound lower-bound)))
              (push (ranged-random lower-bound upper-bound) coordinates)
              (push (ranged-random (- range) range) velocity)))
      (make-instance 'particle
         :coordinates (reverse coordinates)
         :velocity (reverse velocity))))


This might look completely different from good old generate-particle-2d, but if you look a little closer it actually does the exact same thing.


If you go back to generate-particle-2d (look here if you don’t have the code handy) you’ll notice that we’re using a pretty basic pattern:

  • Get the X boundaries for the particle (from the function arguments)
  • Calculate the range of possible X values using the X boundaries
  • Use the X boundaries to generate a starting X position
  • Use the range of possible X values to generate a starting X velocity.
  • Do the same thing for Y


So the algorithm is clear. Find out the boundaries and range for one of our problem dimensions. Use that information to generate random starting positions and starting velocities. Repeat the process for every other variable in the problem.


That’s what the loop in our new function is doing. It goes through every boundary pair in the boundaries list and then uses those boundaries to generate a random starting location and starting velocity. So if we are trying to optimize a five variable function our loop will run five times and we’ll end up with coordinate and velocity lists with five starting numbers, just like we want.


A few Lisp tricks to look out for:


let* is just let but with the added bonus that you can define variables by referring to other variables from inside the same let, which you normally can’t do. To see what I mean try running these two functions and see what happens (spoiler, the normal let crashes):


(let ((x 1) (y (+ x 1))) (print y))

(let* ((x 1) (y (+ x 1))) (print y))


Also, up until now we’ve mostly just hard coded entire lists into our code. We haven’t had to build many on the spot. But now that we need to we can rely on push, which adds a new value to the beginning of an existing list through calls like (push new-value list).


Unfortunately, pushing values to the front of a list gives us the exact opposite order from what we wanted, which is why I call reverse before inserting the coordinate and velocity list into the new particle. All this reversing isn’t super efficient, but since we only do it once per particle it’s not a big deal.


Always Check Your Work


We can now build particles in as many dimensions as we want, but without an easy way to look at those functions its hard to tell how well our new particles work. So let’s finish up today with a new print-particle function to help us see what’s going on inside our particles:


(defun print-particle (particle)
   (format t "coordinates: < ~{~a ~}>~%" (coordinates particle))
   (format t "velocity: < ~{~a ~}>~%" (velocity particle)))


This deceptively short function actually packs quite a punch thanks to the fact that format has its own internal programming language that lets us do ridiculously complicated things like loop through a list to build complex strings.


The key to this bit of output magic is the ~{ ~} symbol. You use this special syntax by putting formating rules inside of the brackets and then passing the brackets a list. The bracket will then repeat it’s internal formatting rules as many times as is necessary to use up the entire list.


In this case the brackets are surrounding ~a, the classic “print one symbol” keyword. If we give the brackets a list with five numbers it will repeat the ~a five times and print them all. If we give the brackets a list of ten numbers it will repeat the ~a ten times and print them all.


Wrap this up with a couple angel brackets (< >) and a newline symbol (~%) and we have a pretty good looking geometric point, as you can see here:


[2]> (print-particle (generate-particle ‘((0 10) (0 10) (0 10))))

coordinates: < 3.952018 1.9228482 5.205475 >

velocity: < 4.249467 -0.7016258 1.7657127 >

NIL

[3]> (print-particle (generate-particle ‘((0 10) (0 10) (0 10))))

coordinates: < 5.9381933 5.0129404 9.165462 >

velocity: < -9.870724 9.138313 0.05269909 >

NIL

[4]> (print-particle (generate-particle ‘((-1 1) (-10 -5) (5 10) (0.1 0.3))) )

coordinates: < 0.82865 -7.275191 6.707388 0.2633261 >

velocity: < 1.720598 3.7108212 -2.178558 -0.03630188 >

NIL


Take a look at that, two nice 3D particles and a single 4D particle. Looks like our flexible particle system is up and running.


Sadly, our higher dimensional particles don’t actually do anything yet. We’ll save that for next time, when we update our swarm algorithms to start using the higher dimensional particles to optimize higher dimensional functions.


* Technically all cats are N-Dimensional, where N is usually 3.

Book Review: Land of Lisp

So you’ve been reading “Let’s Program A Swarm Intelligence” and now you want to learn how to program in Lisp. In that case I would suggest Land of Lisp by Conrad Barski, which holds the honor of being the only programming book where I followed along and typed up every single code example in the book without ever feeling tempted to just skim the code and skip to the next chapter.


A big part of this is because every example in Land of Lisp comes in the form of a simple game. And I love games! Odds are you do too. I mean, honestly, ask yourself this: Would you rather practice object oriented programming by writing yet another employee registry* or by writing up a text-driven combat arena where a brave hero has to fight against a horde of slimes, hydras and bandits?


But the coding exercises weren’t the only thing I liked. Land of Lisps is just an overall humorous book filled with cartoon sketches, silly stories and humorous analogies that make the book fun, easy to read and avoid overwhelming you with technical details. It gives the lessons a nice casual pace that’s perfect for a newcomer to the language.


The focus on simple games also has the benefit of introducing a lot of very valuable programming techniques and data crunching algorithms. After all, you can’t program a boardgame without a boardgame AI and you can’t program a boardgame AI without learning some real cool search-and-sort algorithms. So while Land of Lisp is primarily a Lisp textbook it also includes a tasty side order of computer science.


The only downside to Land of Lisp is that it doesn’t make a very good reference book. The games and cartoons and stories that made it a fun learning experience just get in the way when you’re trying to track down a specific fact as quickly as possible. So while Land of Lisp will give you a solid foundation in the language odds are you will end up relying on other Internet or book resources for those times when you’re halfway through a program and really need a reminder on what “loop and collect” syntax looks like.


Final recommendation: If you are a complete Lisp beginner then Land of Lisp is a great and entertaining way to learn everything you need to know to write moderately complex Lisp programs. It won’t make you an expert, but it will teach you everything you need to know in order to start practicing and studying the more complex topics that eventually will.


* The employee registry seems to show up a lot in programming books. Usually something like “Manager and Sales Person both inherit from Employee but override the calculate_pay method.” It’s a solid and useful example… it’s just a really boring one.

Let’s Program A Swarm Intelligence 12: Is That A Trick Question?

I’m Getting Bored Of The Double Parabola


For test purposes the double parabola was a really great function to minimize: easy to understand, easy to visualize and easy to double check. But it’s also kind of boring and doesn’t really test the strengths and weaknesses of our swarm intelligence.


So I’ve come up with three new functions to help break the parabolic monotony we’ve gotten ourselves stuck in.


Finding A Minimum In A World With No Minimums


Optimizers are based around the idea that problems actually have optimum answers, that some solutions to a problem are better than others. But what if this wasn’t the case? What if every possible answer was equally optimal? What if every answer is exactly the same?


(defun flat-function (x y)
   "Always return 7, because it's a nice number"
   7)


This function technically has a minimum of 7, but that minimum exists everywhere. There is no wrong answer. So let’s see how the swam optimizer handles this.


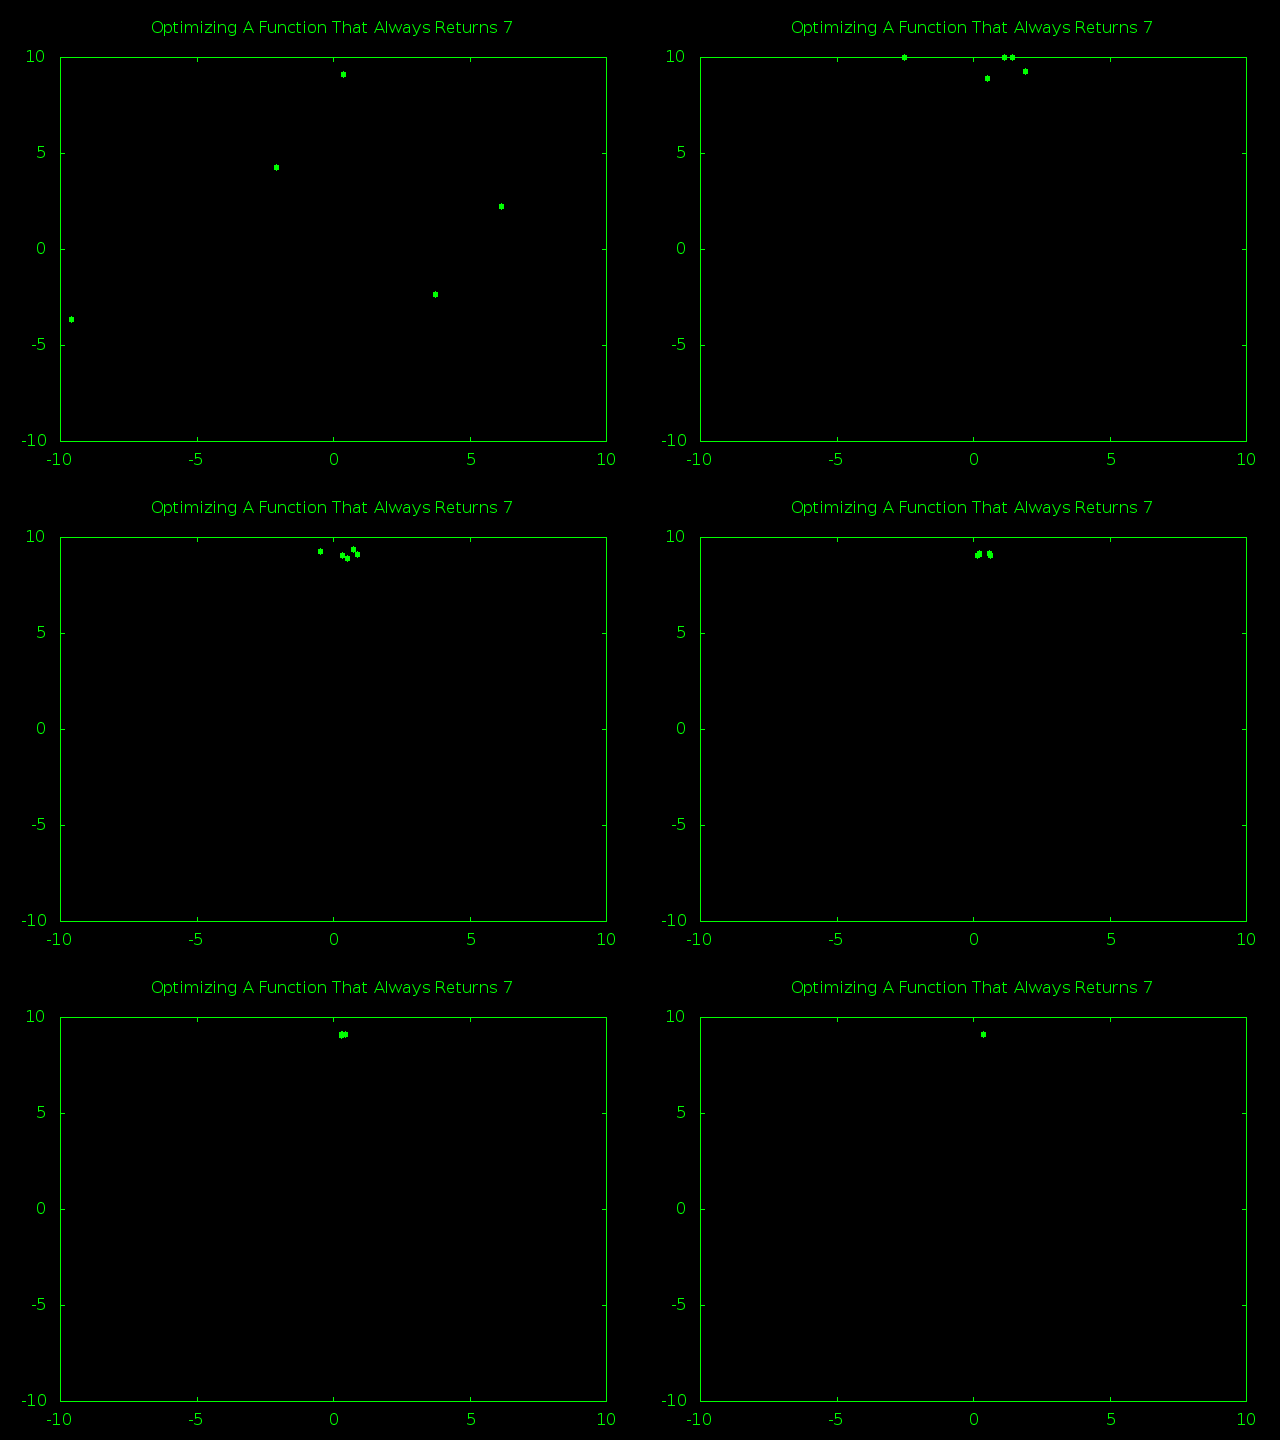
An animation of a swarm optimizing a flat function

A swarm optimizing a function with no optimum… whatever that means


Basically the swarm just latched onto the first guess it made, which obviously returned 7. Since no other guess ever returned anything smaller than 7 the swam quickly gravitated to that first, random guess.


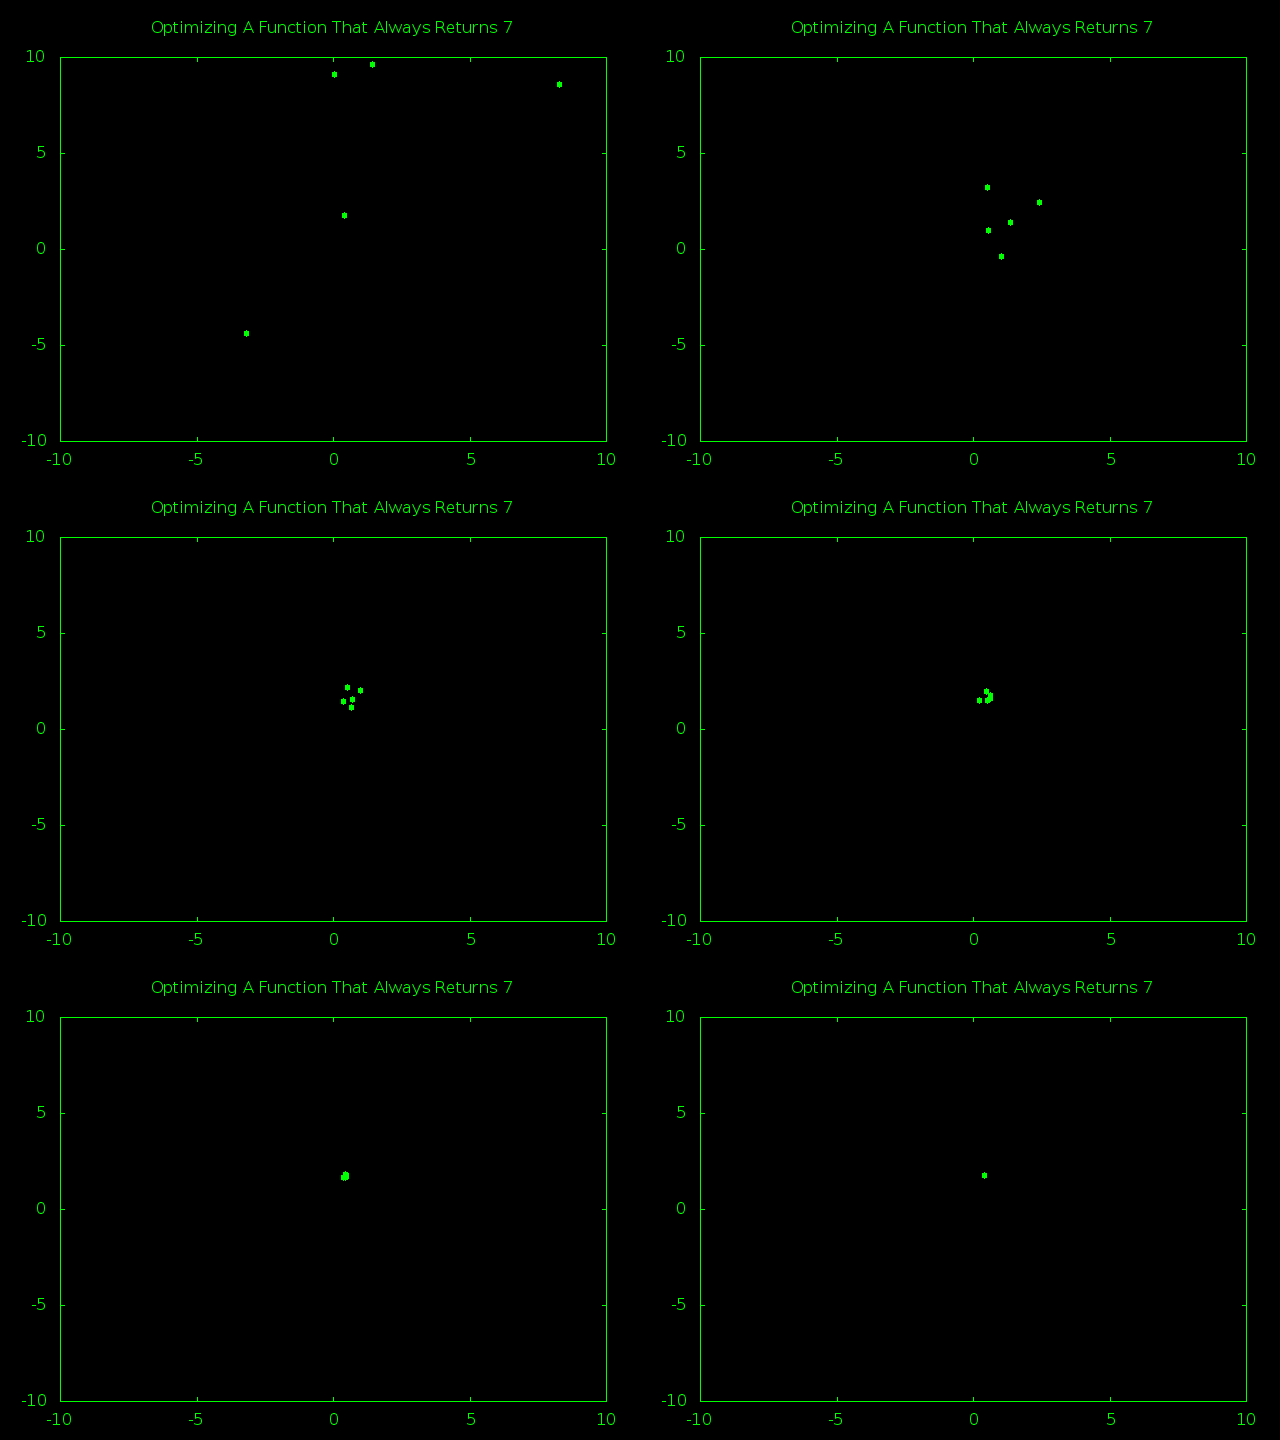
You can see here that I ran the optimizer again and it got a different but equally correct answer. So the swarm optimizer can handle flat functions just fine by generating a random answer and sticking with it.


An animation of a swarm optimizing a flat function

Same size swarm optimizing the same flat function but getting a different random answer


That was actually more boring than the parabola. Let’s move onto something else.


There’s A Hole In Your Problem Space


The parabola is a nice smooth function where values change gradually and it is easy to just “roll down the hill” to find the minimum. We’re going to mix that up now by creating a function that is mostly a smooth parabola, but also has a sudden big hole somewhere around (3,3). The true minimum will be inside that hole.


(defun double-parabola-with-hole ( x y)
   (if (and (>= x 3) (<= x 3.1) (>= y 3) (<= y 3.1))
      (- (+ (* x x) (* y y)) 100)
      (+ (* x x) (* y y))))


This is a pretty simple step function. If X and Y are both inside the tiny window of 3 to 3.1 then we calculate the normal parabola and then subtract 100. Otherwise we just calculate the normal parabola. This results in a problem space that basically looks like a giant bowl with a really deep but tiny square hole cut into one of the sides.


The test here is to see if the swarm can find that hole or if it just rolls down the hill and gets stuck thinking (0, 0) is the the true minimum instead of the local minimum it really is.


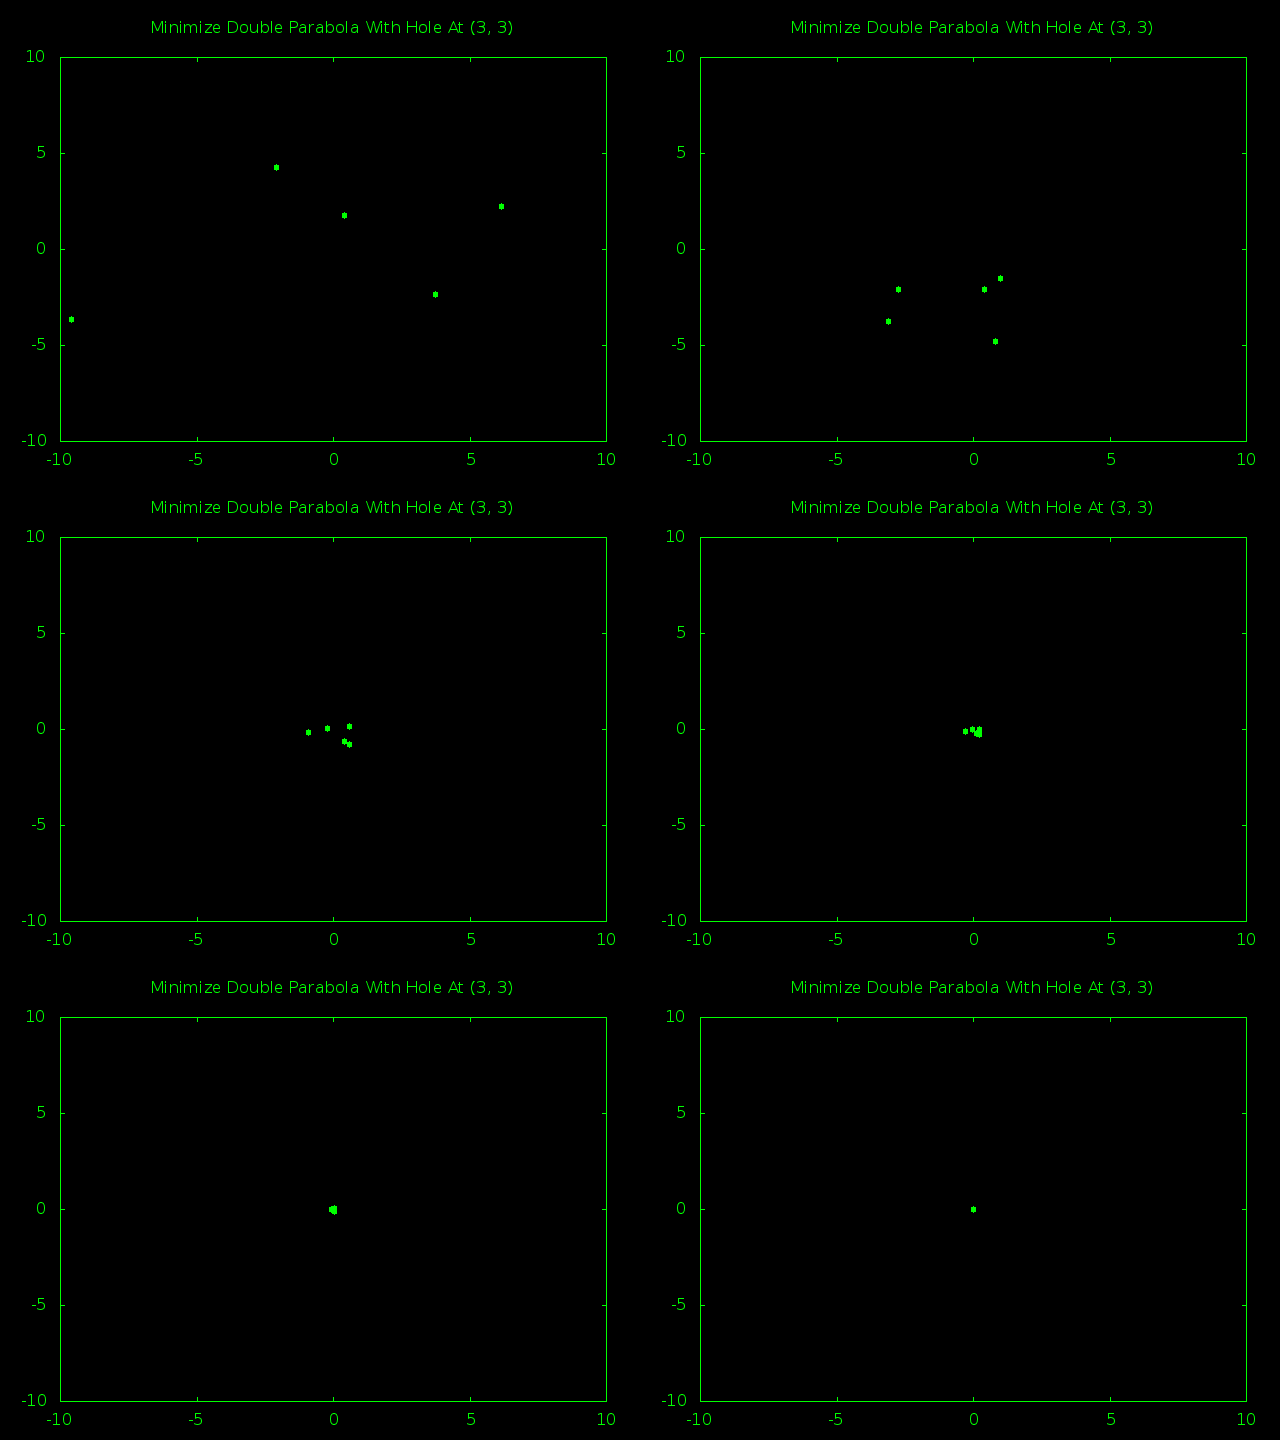
An animation of a small swarm failing to optimize an unusual function

That’s not the minimum!


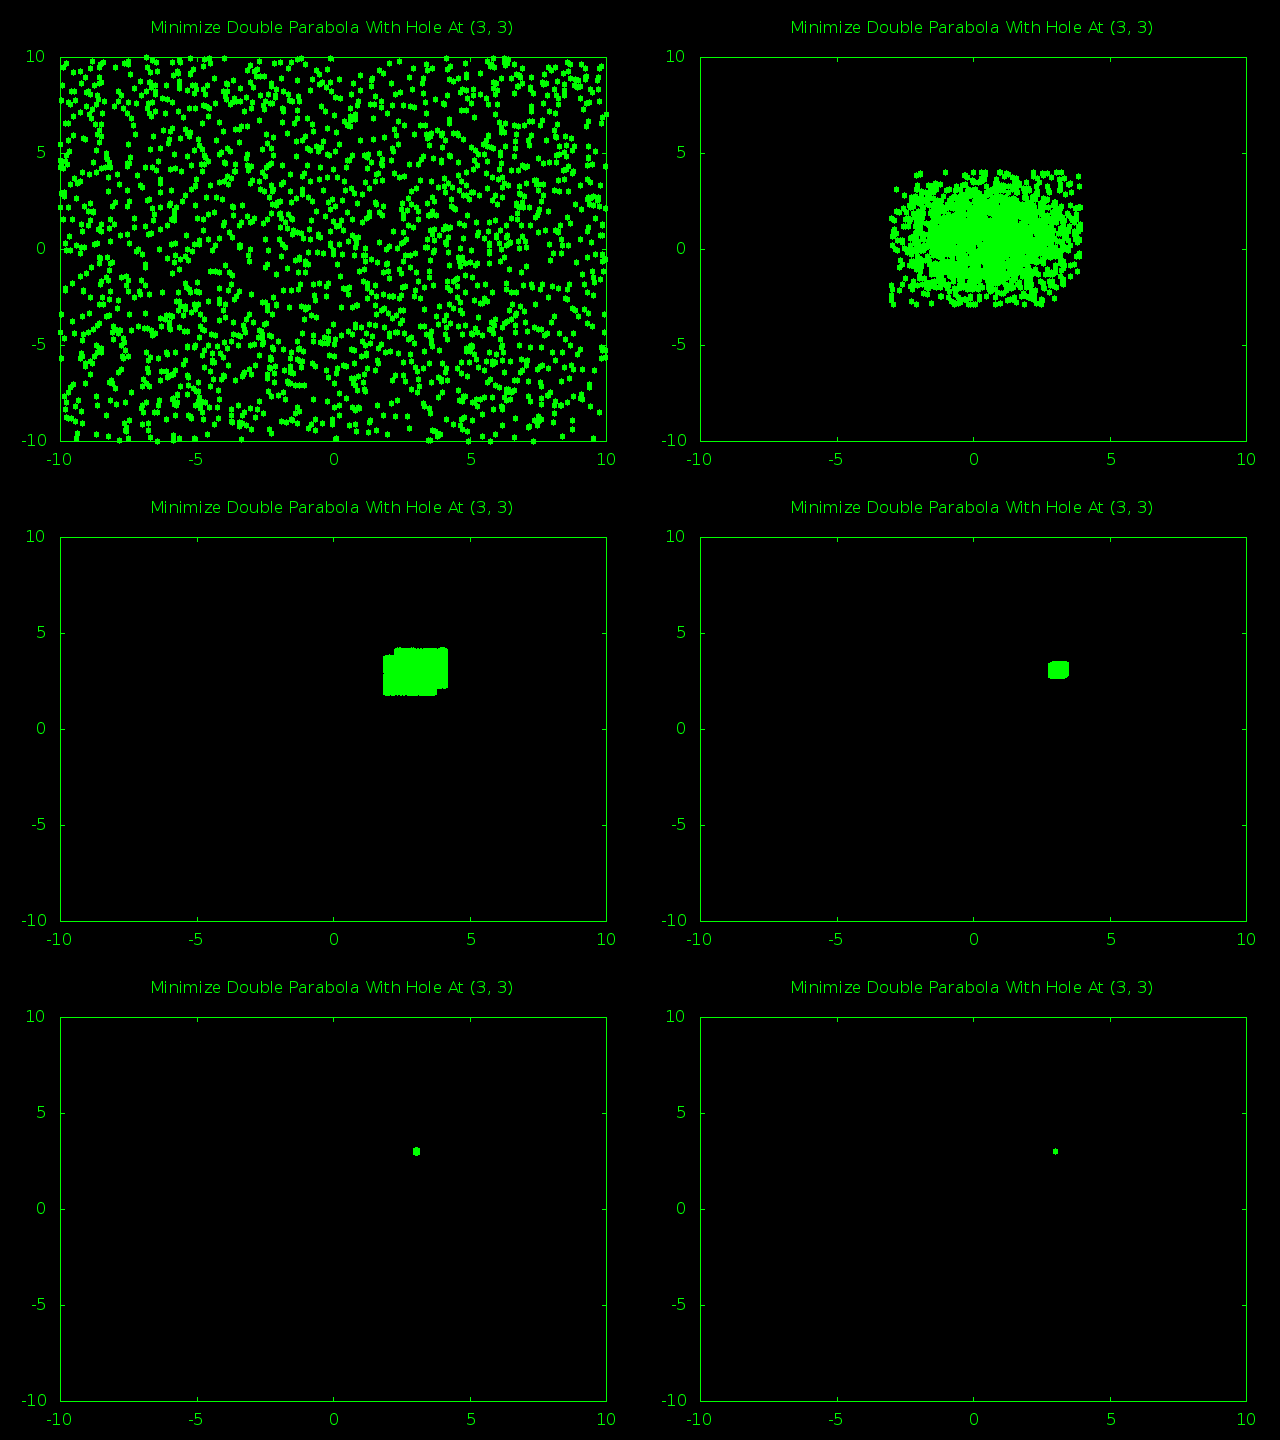
A quick look at this animation shows that my normal 5 particle swarm running for 75 iterations just can’t find the tiny true minimum hiding at (3, 3).


Increasing the iteration count isn’t going to help; the swarm will just spend even more time zooming ever closer to the local minimum at (0, 0).


But if more time won’t help, what about more particles? The more particles we have zooming around the bigger the chances there are that one of them will eventually stumble across our hole and alert the swarm that they really need to be looking in the (3, 3) region.


So I started kicking up the size of the swarm. 50 particles was no good. 100 particles failed too. 200, 300, 400, 500… nothing. They all just gravitate to the origin.


Time for the big guns. A 1,000 particle swarm managed to find the true minimum hole a little less than half the time. A 2,000 particle swarm had closer to an 80% success rate. Here is a snapshot of the 2,000 particle swarm in action.


bigswarmcanfindsmallhole


First off, isn’t it kind of cool how the way we define our borders wound up squashing the swarm into a big rectangle shape instead of the generic blob we would expect?


Second, you can actually see that at the start the swarm still thought that (0, 0) was the smartest place to look for a minimum. It was only after the first few steps that one of the particles got lucky and noticed that there were even smaller values around (3, 3) and managed the drag the entire swarm in the right direction.


I suspect that if our hole was even farther away from the obvious fake minimum then it would take even more particles to reliably find it. For example, if the hole was at (9, 9) you would probably needs tends of thousands of particles just to make sure that even after most of the particles headed straight for the origin there were still a few thousand slowly circling the edge.


Exercise for the reader: Create a double-parabola with a 0.1 x 0.1 hole at (9, 9). Find out how big the swarm has to be before it can find the right answer 90% of the time.


Bonus Exercise for the reader: Create a series of double parabolas with 0.1 x 0.1 holes at (1, 1), (2, 2), (3, 3), (4, 4) and so on until (9, 9). Record how big the swarm has to be in order to achieve 90% success rate for each hole. Is there a pattern between how far away the hole is from the natural parabola minimum and how large the swarm has to be to find it?


How To Get Better At Finding Holes


This whole “find the tiny square where the optimal value is hiding” shows off the big weakness of our overly simplistic swarm intelligence. Because particles obsess only about the global best answer so far they do not spend a lot of time exploring their own corner of problem space before shooting off and clumping up with the other particles. Unless we use a huge swarm we are at high risk of getting stuck on local optimums.


There are a couple ways an ambitious reader could fix this problem. One would be to upgrade the swarm so that particles keep a memory of their own best solution so far in addition to the global best solution and then have them choose their next guess based off of both of those numbers. This will slow down how fast the swarm clumps together and give you a better look at all of problem space.


Of course, this isn’t a miracle solution. It really only works in scenarios where you have multiple, obvious trends. Imagine a plane filled with lots of little valleys, some shallower than others. Local best answers allow particles to roll towards the bottom of their own valley before getting too excited about the global smallest answer so far. This way a particle that randomly starts out at the bottom of a shallow valley can’t dominate all the other particles that randomly started near the top of much deeper, and better, valleys.


However, think back to our parabola with a whole. All the particles are in the same “bowl”. Their local bests will lead them to roll down to the center, just like the global best did. So in this particular case the local best doesn’t really help us.


So another option might be to add some extra chaos into the system by creating a new type of “scout” particle that doesn’t care as much about global or local bests as a normal particle would. Instead it randomly changes its velocity, breaking away from the central swarm in order to explore areas that the rest of the swarm ignored.


To be honest it’s a long shot that one of these scout particles is going to find something that the rest of the swarm somehow didn’t on their way to clumping together… but a small chance is better than no chance. Even better, since scout particles don’t settle down like normal particles their chance of finding a new answer just keeps going up the longer the swarm is alive.


So if you plan on having a long running swarm, maybe on that runs forever and reports its current best every hour, then you really should probably code up some scout particles. This is especially important if you are working with a problem space that changes. It would be sad if a new optimum suddenly appeared in a corner and you never found out because your particles had already clumped together somewhere else and were no longer active enough to notice the change.


A Bumpy Problem Space


So we’ve already covered a problem with no optimums* and a problem with one very hard to find optimum. Now let’s try a problem with a couple dozen optimums spread evenly throughout problem space.


(defun double-sine-wave (x y)
   (+ (sin x) (sin y)))


I’m sure you’ve seen a sine wave. This is two sine waves put together in what would look like a giant field filled with dozens of hills and valleys, all exactly the same size.


Honestly this will be a boring experiment. If we had local minimum code then we could probably see a bunch of particles rolling around their nearest valley before finally all grouping up at some randomly selected global best valley… but that’s not what we have. All we have is a global minimum so odds are the particles will bounce around a bit and then all clump up at one spot pretty fast.


[5]> (defparameter *swarm-size* 25)

*SWARM-SIZE*

[6]> (defparameter *swarm-iterations* 75)

*SWARM-ITERATIONS*

[7]> (defparameter *swarm-output* (swarm-minimize-2d #’double-sine-wave ‘(-10 10) ‘(-10 10)))

*SWARM-OUTPUT*

[8]> (first *swarm-output* )

(-1.570653 4.7121253)

[9]> (double-sine-wave -1.57 4.71)

-1.9999969


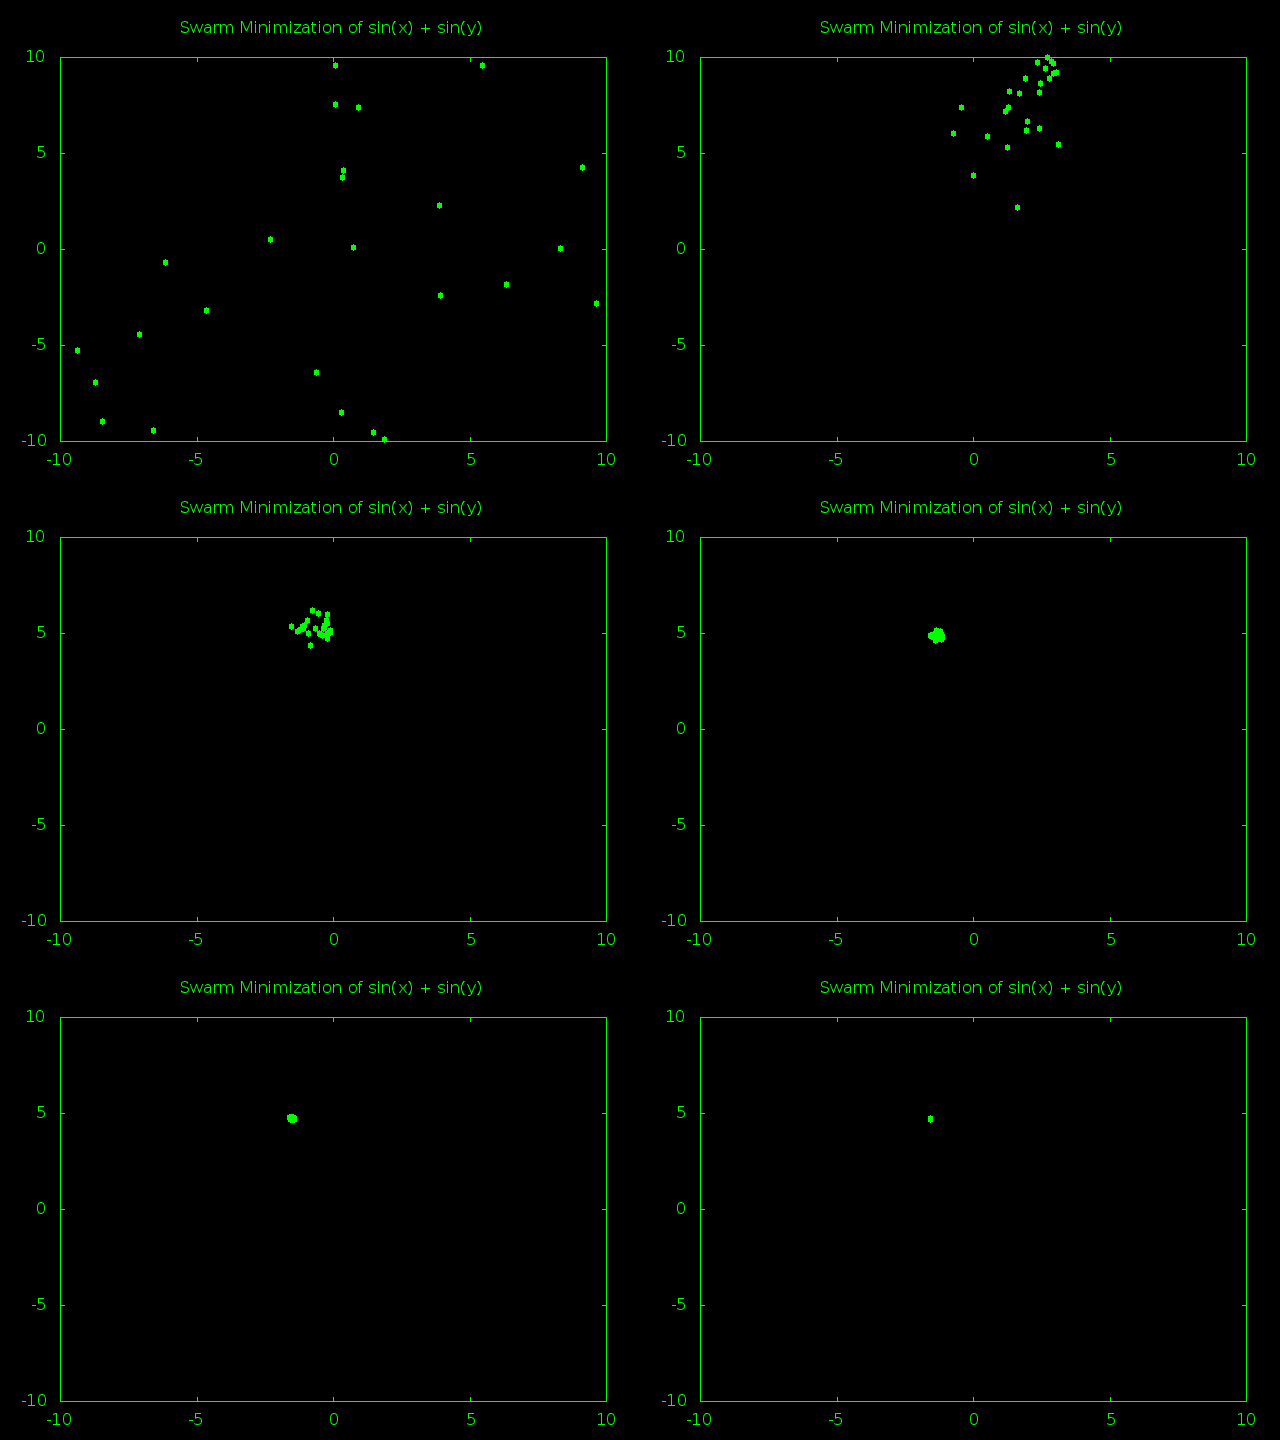
OK, -2 is the smallest value you can get by adding together two sine functions so good job there. Now it’s time to animate the history:


An animation of a swarm optimizing a sine wave based function

The minimum is over here… or is it over here? Wait, definitely here!


Meh, I guess this is *kind-of* interesting. You can see how the first global minimum was inside of one valley, then a particle bumped into another valley and the whole swarm started moving that way before bumping into a third valley and finally settling there. It’s at least more interesting than the standard double parabola where everything heads for the center almost from the very start.


Time To Transcend This Plane Of Existence


I think I’ve covered everything I wanted to for two dimensional swarms, so next time around we’ll be working on creating a more general swarm that can handle higher dimension equations. The hardest part is probably going to be coming up with some easy to understand test functions.


Does anybody have any idea what a nine dimensional octuple-parabola would look like?


* Or is that an infinite number of optimums? Consider it the math version of the “is the glass half empty or half full” question.

Let’s Program A Swarm Intelligence 11: Turning Your World Upside Down

Maxing Our Mins


Our current AI is pretty good at minimizing equations, but what if you want big numbers instead of small numbers? For example, what if you want to find the maximum for the equation -1 * (x^2 + y^2)? Or as we say in Lisp:


(defun inverse-double-parabola (x y)
   (* -1 (+ (* x x) (* y y))))


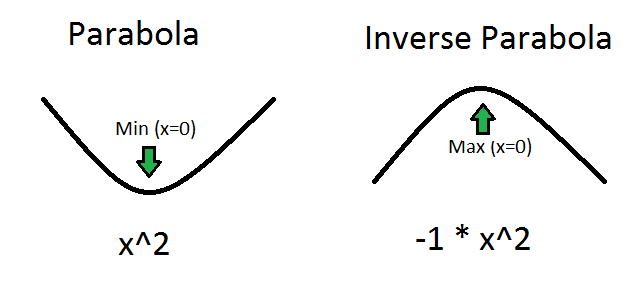
This is the opposite of our normal double parabola. This time the bigger x and y get the more negative and small our answer becomes. So the origin (x=0, y=0) will give us the biggest possible answer instead of the smallest possible answer.


a parabola and an inverse parabola

A badly drawn sketch of the difference between a parabola and an inverse parabola

Now how are we going to go about building a maximizer for this problem? Well, hopefully you remember back in part three where we showed that you can turn a minimizer into a maximizer just by multiplying all your results by -1 before passing them to the minimizer. That’s enough to turn big answers into small answers so our minimizer can track them down.


Our next task is clear then: We need to create a new function that accepts a maximizable function, creates an inverse version of it and then feeds that inverse function into the minimizer we already have.


Lambda: Kind Of A Big Deal


Since it looks like we need to build new functions on the fly I think it’s about time to introduce the mighty lambda. This powerful Lisp feature allows us to create new anonymous functions right on the spot and then immediately assign them to a variable or pass them to a function.


Explaining anonymous functions and how they differ from named functions can be a little tricky, so let’s just jump to some examples. The basic syntax is:


(lambda (argument names) (code that uses argument names here))


For example, here is a lambda function for multiplying a number by 3:


(lambda (x) (* 3 x))


And here it is an example of using lambda to assign an anonymous function to a variable and call it later:


[1]> (defparameter *test-fn* (lambda (x) (* 3 x)))

*TEST-FN*

[2]> (funcall *test-fn* 9)

27


For a second example let’s look at something from our swarm intelligence code. Here is how we normally minimize a double parabola, by passing a reference to a pre-existing doube-parabola function:


(swarm-minimize-2d #'double-parabola '(-10 10) '(-10 10))


But we could also use lambda to just define a double parabola function right on the spot:


(swarm-minimize-2d (lambda (x y) (+ (* x x) (* y y))) '(-10 10) '(-10 10))


This syntax is going to be very important in just a few seconds!


Lambda Maximizer To The Max!


Now we can talk about how to use Lisp to invert the results of a function call. First, I’m sure you remember that when we have a function inside of a variable named “fn” we can call that function and pass it two variables like this:


(funcall fn x y)


And if we know that the function is going to have numeric output we can invert it like this:


(* -1 (funcall fn x y))


Now here comes the tricky part. If we have a function inside a variable like “fn” we can use lambda to create a new function that accepts two variables, passes them to “fn” and then inverts the result. We can then pass this entire anonymous inverse function to swarm-minimize.


(defun swarm-maximize-2d (fn x-limits y-limits)
   (swarm-minimize-2d (lambda (x y) (* -1 (funcall fn x y))) x-limits y-limits))


If you understand this one-line function then you’ve mastered a lot of what makes Lisp so powerful.


And here it is in action:


[7]> (defparameter *swarm-iterations* 75)

*SWARM-ITERATIONS*

[8]> (defparameter *swarm-output* (swarm-maximize-2d #’inverse-double-parabola ‘(-10 10) ‘(-10 10)) )

*SWARM-OUTPUT*

[9]> (first *swarm-output*)

(-5.1605515E-5 -0.0015050085)


What do you know, that’s more or less the maximum for a double inverse parabola.


Stay On Target


Back in part three we also talked about how you could use a minimizer to help you hit a specific goal by minimizing the distance between your target and your results. We can pull this off as another one line function thanks to lambda:


(defun swarm-target-2d (fn target x-limits y-limits)
   (swarm-minimize-2d (lambda (x y) (abs (- target (funcall fn x y)))) x-limits y-limits))


[10]> (defparameter *swarm-output* (swarm-target-2d #’double-parabola 3 ‘(-10 10) ‘(-10 10)))

*SWARM-OUTPUT*

[11]> (first *swarm-output*)

(-1.5764234 -0.7178333)

[12]> (double-parabola -1.5764234 -0.7178333)

3.0003953


In this test I loaded up our classic double parabola and gave it a target of ‘3’. Seventy five iterations later the swarm comes up with (-1.6, -0.7) as a possible input and when we plug that in we get very close to the 3 we were hoping for. Success!


Conclusion


We covered one of the stranger but more powerful features of the Lisp programming language and used it to magically transform our particle swarm minimizer into a particle swarm maximizer and a particle swarm goal seeking machine. I’d say that’s a pretty good day’s work.


Join me next time as I take our three swarm optimization functions and then do everything in my power to stump them with hard to optimize inputs and strange function patterns.

Let’s Program A Swarm Intelligence 10: Let Me See…

Impress Your Friends And Family With Data Visualization!


We now have a working two dimensional particle swarm optimizer that can reliably minimize simple problems. That’s pretty cool, but you have to be a computer geek to really appreciate it. Give this program to a non computer geek and all they’ll see is a boring command line tool that spits out answers to obvious problems. They don’t understand all the nifty logic going on behind the scenes.


So why not show it to them?


Our swarm is made up of particles that each have a known x and y value. We can graph those points to show what kind of guesses the particles are making at any given point in time. Even people who don’t understand exactly what your program is doing will be impressed by a series of fancy graphs.


I mean, they *might* be impressed. You never know. You must have at least one friend that really likes graphs.


Enter the gnuplot


How to go about turning our swarm data into a swarm graph? Well, we could write our own custom Lisp code for graphing data… but why bother? There are tons of graphing programs already out there and the more time we spend on graphs the less time we have to spend on artificial intelligence. Life is about prioritization!


So what do we need in a graphing program? Honestly, just about any program that can read data from a file and produce scatter-plots from it is good enough for us. You could probably do it with an Excel macro, for example.


But since I’m on a Linux machine at the moment the most convenient option for me is a handy program called “gnuplot”. It’s a powerful graphing tool with tons and tons of options; way more than I could cover in a single blog post. But after messing around for a few hours I figured out some syntax to create one big file that can generate multiple graphs all at once. Perfect for printing out our entire swarm history all in one go!


It looks a little like this:


set terminal png x000000
set nokey
set border lc rgb "#00FF00"
set title "Swarm Minimization: x^2 + y^2" textcolor rgb "#00FF00"

set output 'plot0.png'
plot [-10:10] [-10:10] '-' using 1:2 pt 7 lc rgb "#00FF00"
0.3288231 9.875179
3.6807585 7.472683
-8.19067 -3.7102547
-1.549223 -8.636032
3.1139793 1.0444632
EOF
set output 'plot1.png'
plot [-10:10] [-10:10] '-' using 1:2 pt 7 lc rgb "#00FF00"
8.927804 -4.897444
-10 3.5666924
1.7747135 2.2790432
10 5.109022
10 5.0106025
EOF


The first four lines set up some generic style rules for our graphs. I start by setting the default graph to be an all black PNG image. I then turn off the automatic legend and set the line color (lc) of the graph border to be bright green (since the default black won’t show up against a black background). Finally I add a big green title to the top of the graph.


After that I pick out a name for the file where I want to save the first graph by using set output. Then I use the plot command to actually make the graph, which gets a little complicated.


The first two inputs to plot are the x and y boundaries we want to use in our graph. The third argument is the location of the data we want to graph. Normally this would be a filename, but ‘-‘ using 1:2 lets us instead just type the data we want right into the same file. After that we use pt 7 to choose how we want to draw our data points (7 is code for a filled circle) and use lc again to make our points just as green as our boundaries and title.


With all that out of the way we can finally include the data we want to graph. Each point is represented by two numbers, on their own line and with a space between them. After typing in all the numbers we use EOF to indicate that’s the end of our fake little inline data file.


Then we choose a filename for our next graph with another set output, repeat the plot command and then include the next set of data. And we do that again and again until we’ve graphed all the graphs we want graph.


Formatting Data


With that example file to work with we can start working on some Lisp to grab our swarm history and rearrange it into a gnuplot input file.


The first obstacle we have to deal with is the fact that our swarm intelligence stores history as a list of particle histories. This makes it very easy to grab and read the complete history of any individual particle. Unfortunately, when it comes to graphing we want to do the opposite. Instead of the complete history of one particle we want a single step in the history of every particle.


Example: If we want to draw a graph of how the swarm looked during its third loop through our algorithm we would need the third entry in the history list for every single particle. If we wanted to draw the swam during it’s sixth loop we would need the sixth entry in the history list of every single particle.


Fortunately this isn’t hard thank to loop (again!) and the handy nth function. Like you might expect, the nth function lets you grab items from anywhere inside a list.


(defun get-swarm-history-step-n-2d (swarm-history step)
   (loop for history in swarm-history
      collect (nth step history)))


These three lines of code are all that we need to get a snapshot of the entire swarm at any point in its history.


Efficiency Warning


One quick note here for all you efficiency buffs out there. Lisp lists are wonderful and flexible data structures but they aren’t always the fastest.


The main problem is that you can’t just grab random items out of a list, you have to visit them in order. To get to the third item in a list you first have to grab the first item. The first item tells you the location of the second item, and then the second item helps you find the third item. Now if you instead wanted to find the one millionth item in a list… well you can see how that could start to be a waste of time.


For small amounts of data this isn’t a problem. But when you really need fast access to data no matter where it is inside a list you would probably be better off with something that does allow random access, like an array. Which Lisp supports. So if you want to slightly boost the speed of your swarm that’s one change you could make.


Printing The Data


Now that we can grab slices of swarm history we can put together one last big function to take one slice from every step in the swarm’s history and glue them all together into a file for gnuplot.


(defun print-swarm-history-graph-file-2d (filename swarm-history title x-bounds y-bounds)
   (with-open-file (stream filename :direction :output)
      (format stream "set terminal png x000000~%")
      (format stream "set nokey~%")
      (format stream "set border lc rgb \"#00FF00\"~%")
      (format stream "set title \"~a\" textcolor rgb \"#00FF00\"~%~%" title)
      (loop for i from 0 to (1- (length (first swarm-history))) do
         (format stream 
            "set output 'plot~a.png'~%plot [~a:~a] [~a:~a] '-' using 1:2 pt 7 lc rgb \"#00FF00\"~%"
            i (first x-bounds) (second x-bounds) (first y-bounds) (second y-bounds))
         (loop for position in (get-swarm-history-step-n-2d swarm-history i) do
            (format stream "~a ~a~%" (first position) (second position)))
            (format stream "EOF~%"))))


It’s a big looking function but most of that is just calls to format. Look at this function alongside the sample gnuplot file and it’s pretty easy to see what is going on.


One complication worth looking at is with-open-file. It let’s us create or open a file and then read or write data to it. In this particle case we use with-open-file to create a handle named “stream” pointing to whatever filename is stored in our filename variable. Then we can use (format stream “some text”) to send text to a file instead of to the screen.


And with that the rest of the function is pretty straight forward. We start out by printing all the special rules we determined we need at the beginning of every gnuplot file.


After that we can print the specific coordinates for each step with two nested loops. The first loop needs to run once for every step in our history and set. Then for each step the inner loop needs to get all the individual particle coordinates for that step and add them to the file.


The Moment You’ve All Been Waiting For…


[30]> (load “swarm.lisp”)

;; Loading file swarm.lisp …

;; Loaded file swarm.lisp

T

[31]> (defparameter *swarm-size* 25)

*SWARM-SIZE*

[32]> (defparameter *swarm-iterations* 70)

*SWARM-ITERATIONS*

[33]> (defparameter *swarm-output* (swarm-minimize-2d #’double-parabola ‘(-10 10) ‘(-10 10)))

*SWARM-OUTPUT*

[34]> (first *swarm-output*)

(-1.5024608E-4 0.0011557455)

[35]> (defparameter *swarm-history* (second *swarm-output*))

*SWARM-HISTORY*

[36]> (print-swarm-history-graph-file-2d “swarm-history.txt” *swarm-history* “Swarm Minimization: x^2 + y^2” ‘(-10 10) ‘(-10 10))

NIL


That produces a “swarm-history.txt” file that we can feed into gnuplot. Although I personally suggest you move it to a new folder first before running it. Generating dozens or hundreds of graphs all at once can make a real mess of your development folder. I did all my graph work in a folder named “output” to keep it separate from my code files.


Wherever you decide to do your work, generating your graphs is as easy as:


gnuplot swarm-history.txt


And now you have one PNG file for every guess your swarm AI made. You can finally see the code working.


The Really Cool Part


Now that we have a graph of every step in our swarm algorithm the only logical thing to do is string them all together into one big animation: a simple enough trick for a graphic manipulation tool like Gimp. I’ll leave it up to you to find a good tutorial on how that works.


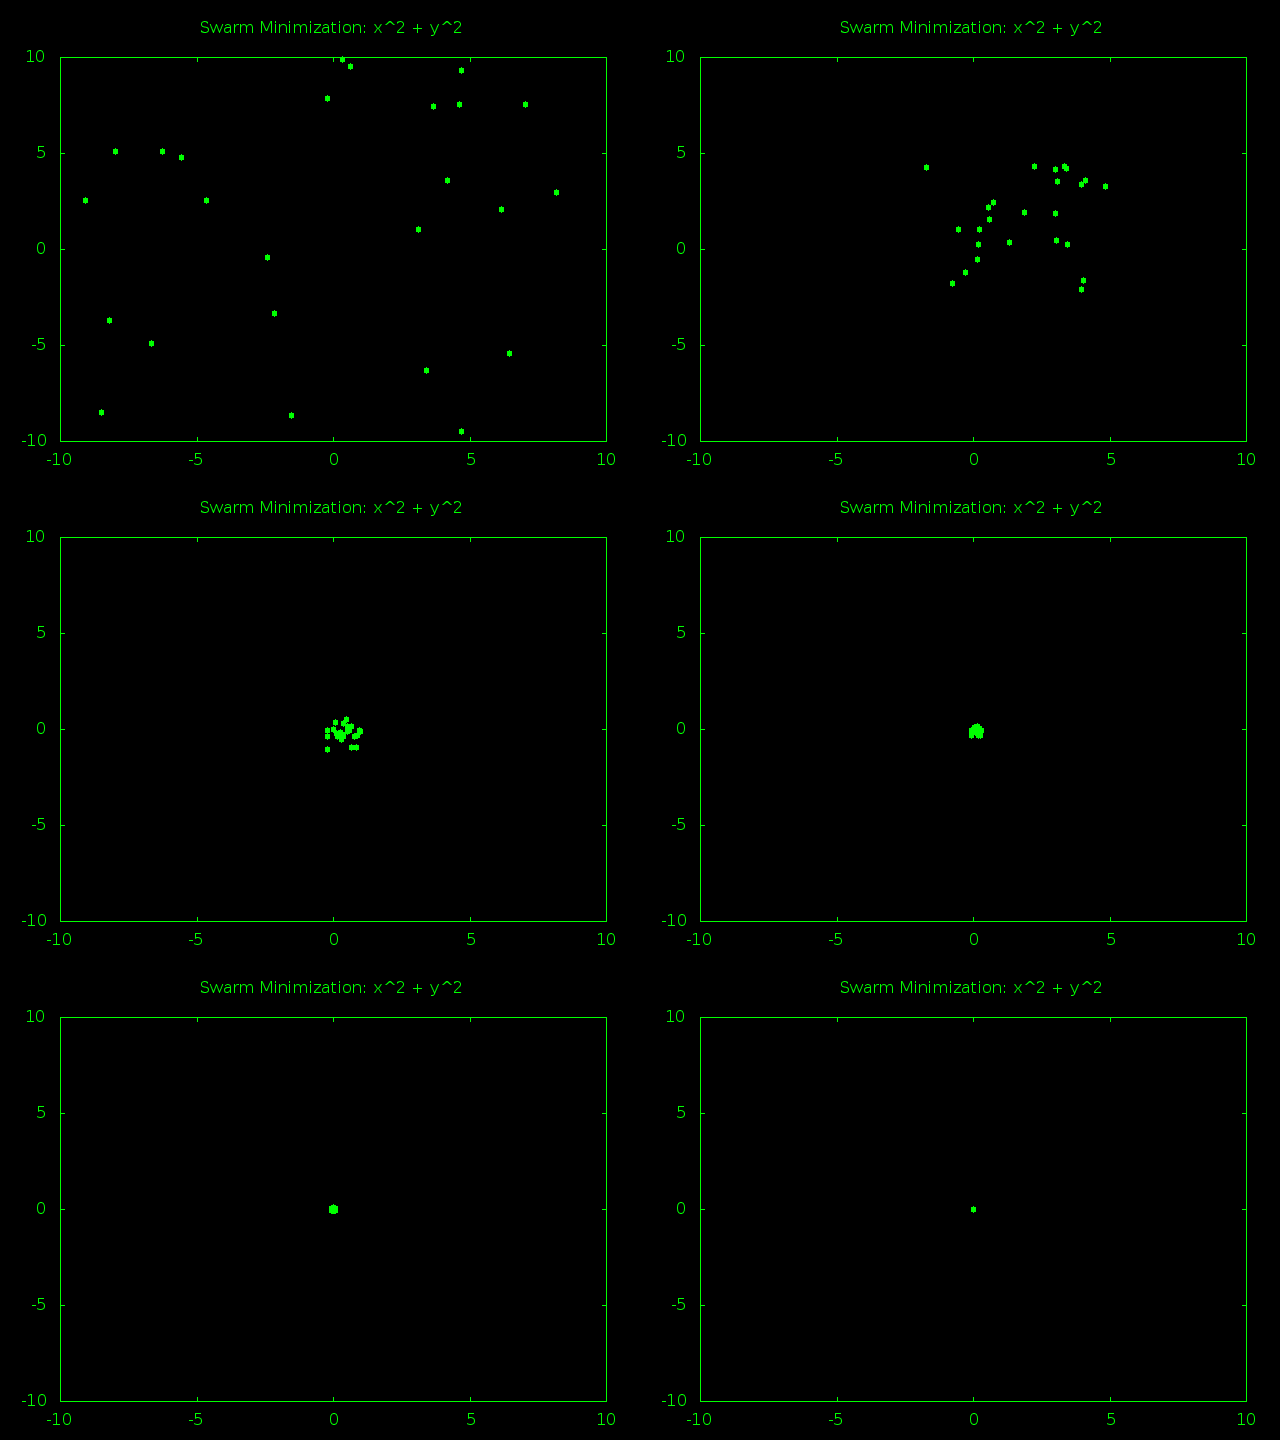
Now we can finally see exactly what our swarm has been up to, and it was just what we expected.


An animated graph of a particle swarm optimizer

Look At That Swarm Swarming!


The swarm starts out spread out randomly all over problem space and the particles are moving very fast, bouncing around at high speeds and trying tons of different answers. After just a few rounds of guesses the particles start to gravitate towards (0,0), the true best answer of x^2 + y^2. As time goes on the particles start slowing down so they can better examine the promising answers near the center of the graph. Finally all the particles converge and stick to one best answer, or at least really close to it.


Next: More Data To Visualize


We now have all the tools we need to visually demonstrate the inner workings of our swarm intelligence (which is a great way to show off to friends). Next time we’ll put those tools to good use by thinking up some new equations for our swarm to optimize. We’ll also finally get around to improving our optimizer to maximize and search for target values instead of just minimizing.